RHRP4 - Client Budget Dashboard
A budget dashboard for the client that provides views for funding, spending, and avoidable costs with data linked to Readiness procedure requests.
This project is password protected
Enter the password to view the full case study.
Overview
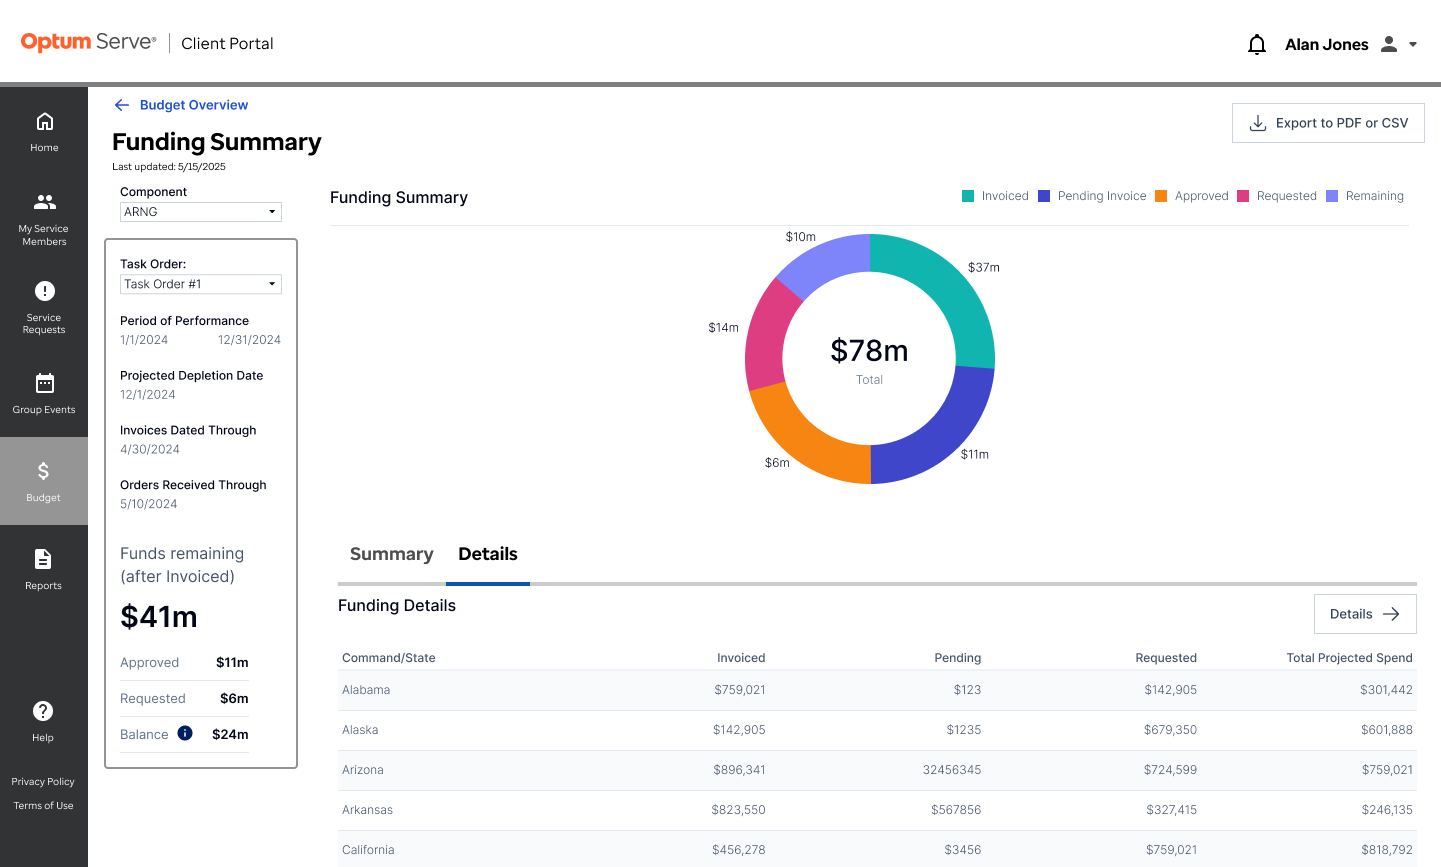
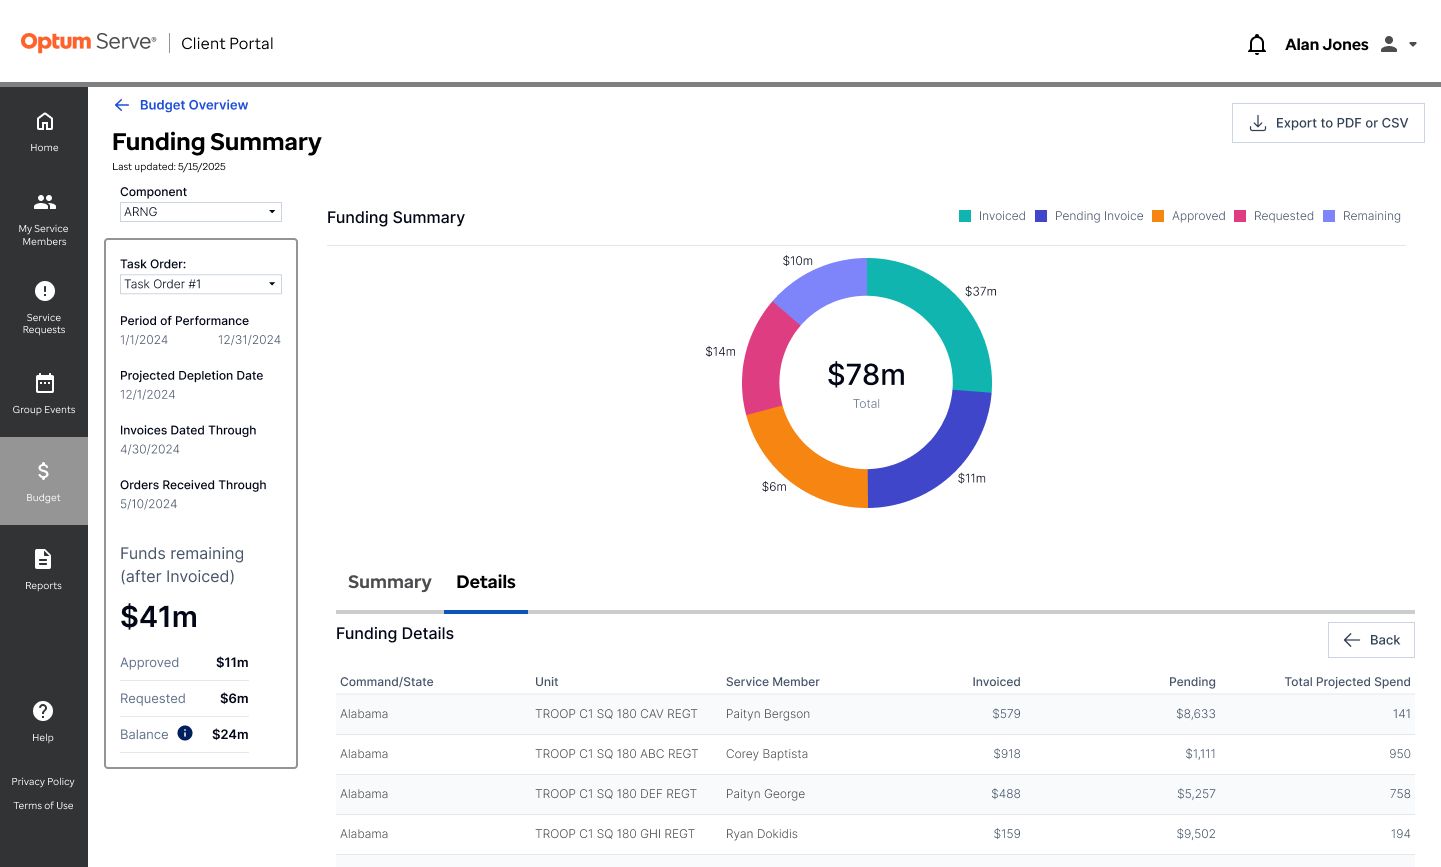
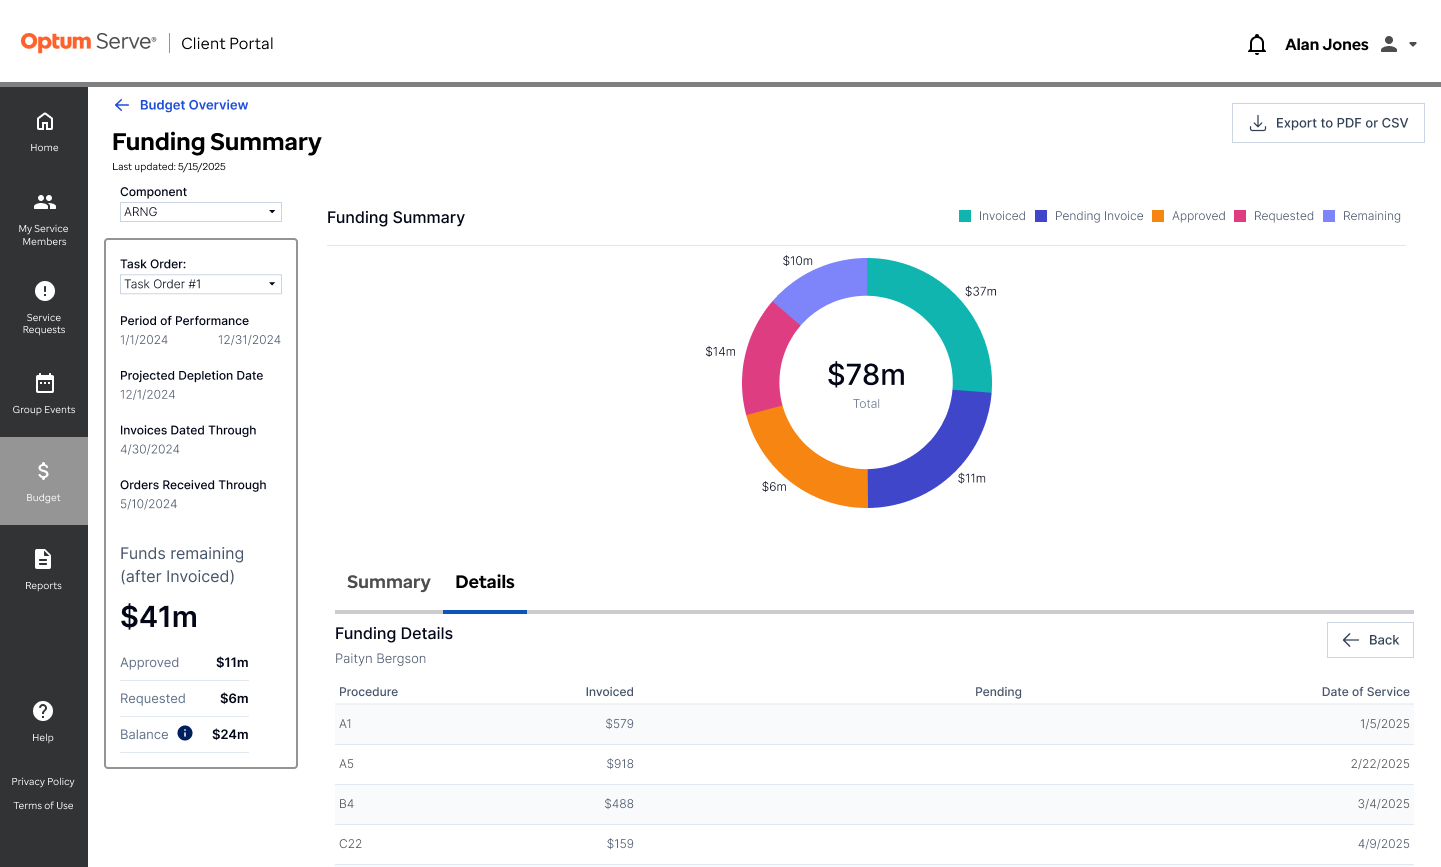
A financial and operational dashboard giving DHA-level, Service-Component-level, and command/state-level views into RHRP-4 funding and spending by task order: obligated, invoiced, expended, and remaining funds, that are organized by state (specifically called out for ARNG), UIC, and RUC, alongside scheduling/no-show/cancellation data.
Problem
Before this, funding status and readiness/scheduling activity likely lived as separate reporting streams — contract financials on one side, appointment/compliance data on the other — with no single place to see how much of the budget is committed, how much is likely to be spent given pending procedures, and how much of that spend is preventable.
DHA needs the aggregate picture, a component needs its own view, and a state or command-level user needs to know if their unit specifically is bleeding money on no-shows.
The PWS defines a late cancellation fee (cancelling <72 hours out) and a no-show fee, billable to either the government or the contractor depending on fault, plus a lesser-known third case — a "swap-out fee" when a component fills a no-show slot with a different SM instead of eating the no-show fee outright. This dashboard highlights it as an actionable category.
Constraints
- Has to forecast future task-order usage/spending by CLIN and Sub-CLIN
- State-level breakout is explicitly called out for ARNG only
- Attribution requirement on every cancellation/no-show
- All financial and scheduling data must be queryable and exportable to Excel and PDF, with monthly reports delivered as a downloadable link via email to the COR
- DHA-level users are likely more comfortable with budget/financial framing, while state/command-level users may be closer to operational/clinical staff
Approach
Cross Team Collaboration
I also had the opportunity to connect with our Associate Director Deputy Program Manager, who served in the Army National Guard. He was a great asset because he provided information about what they used to use vs. what is actually needed in order to be ready to be deployed. He was able to provide initial feedback for a first pass on the dashboard and gave direction as iterations improved.
Initial Wireframes
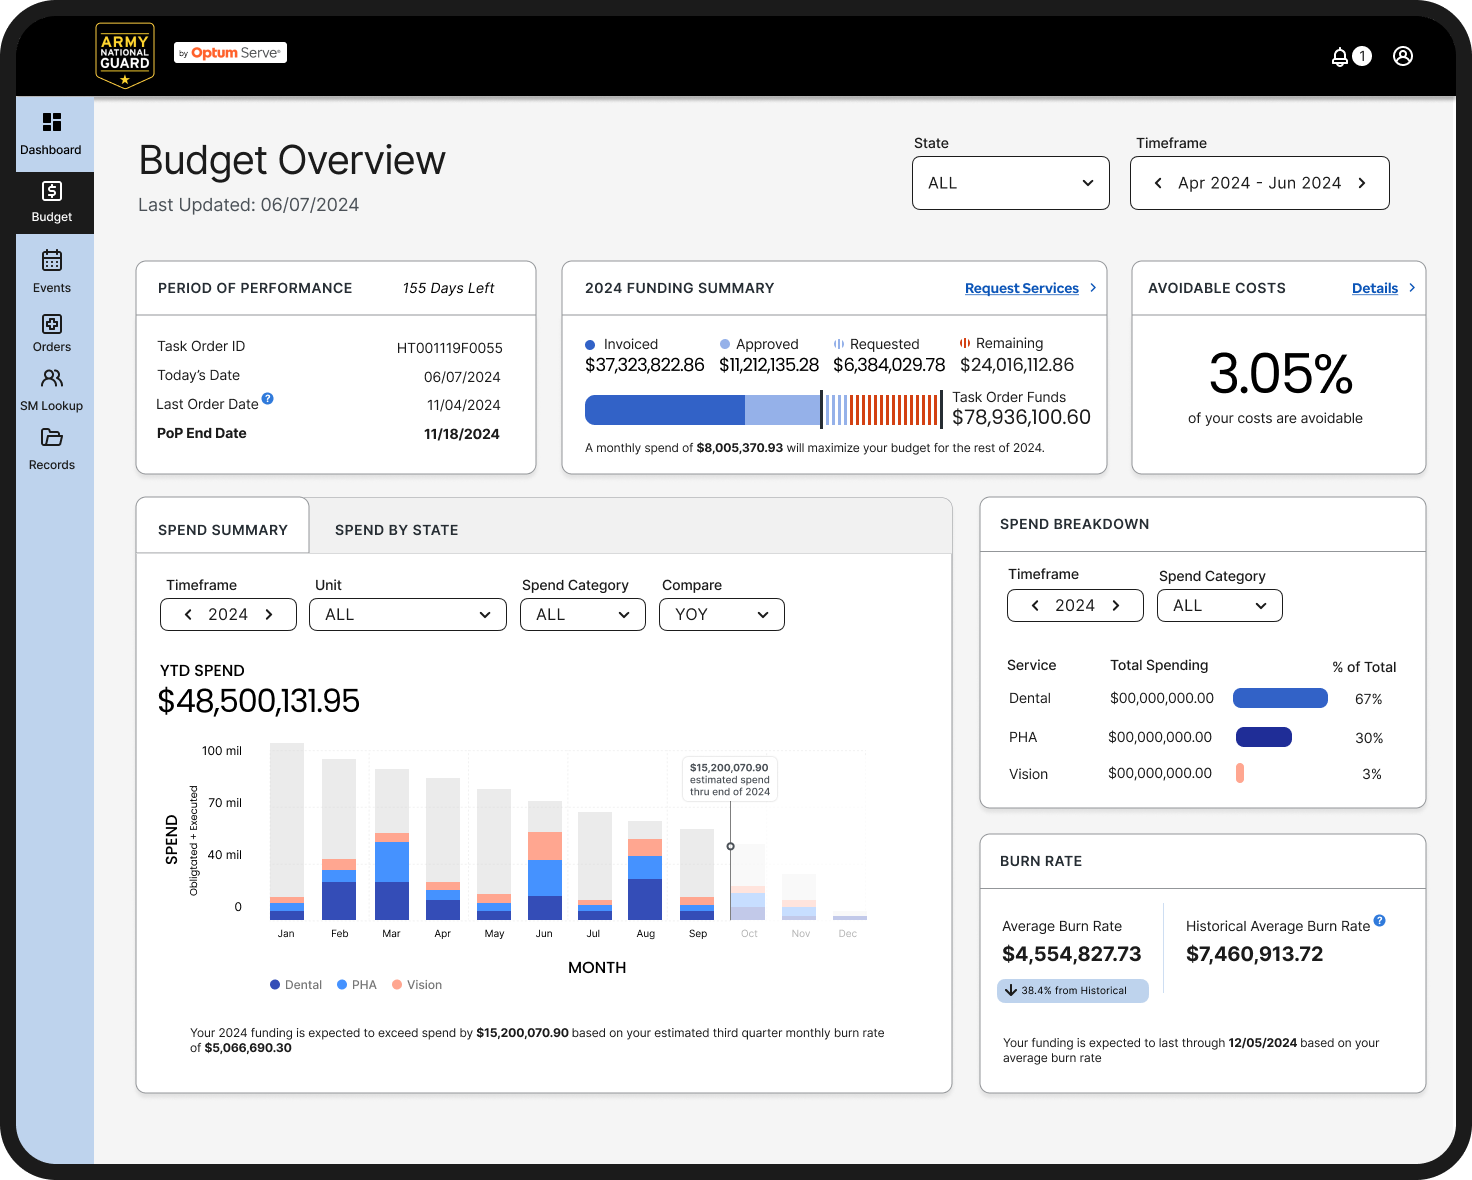
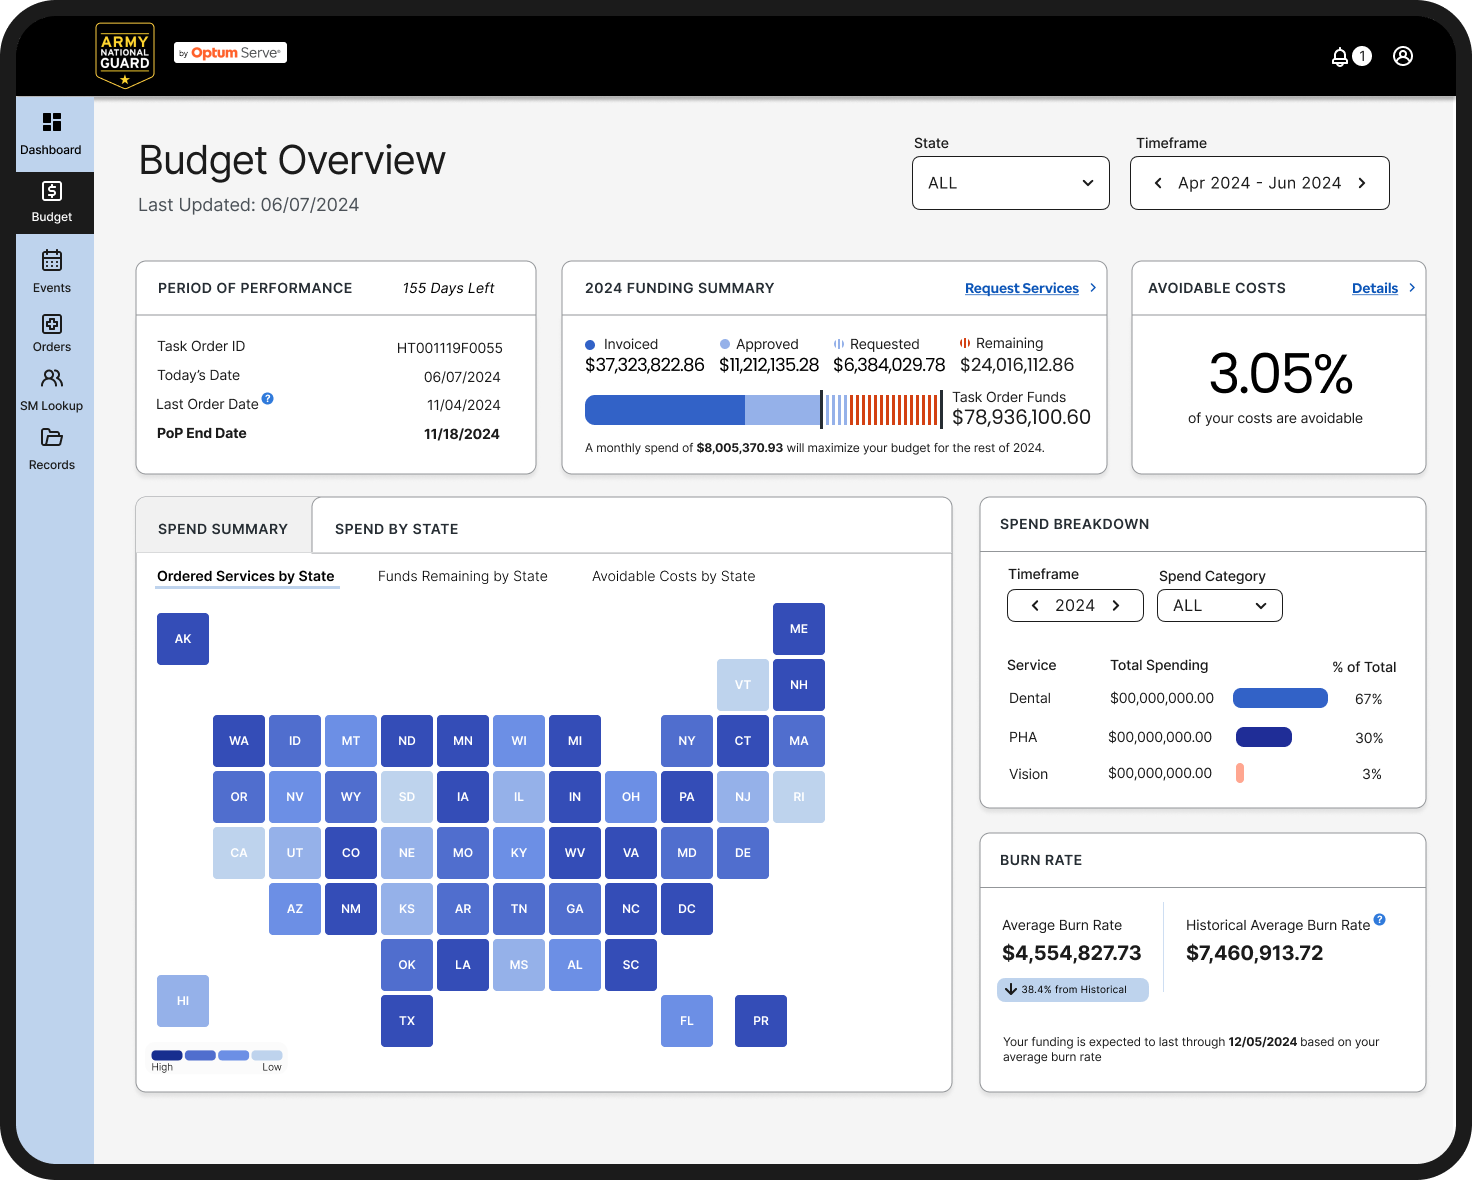
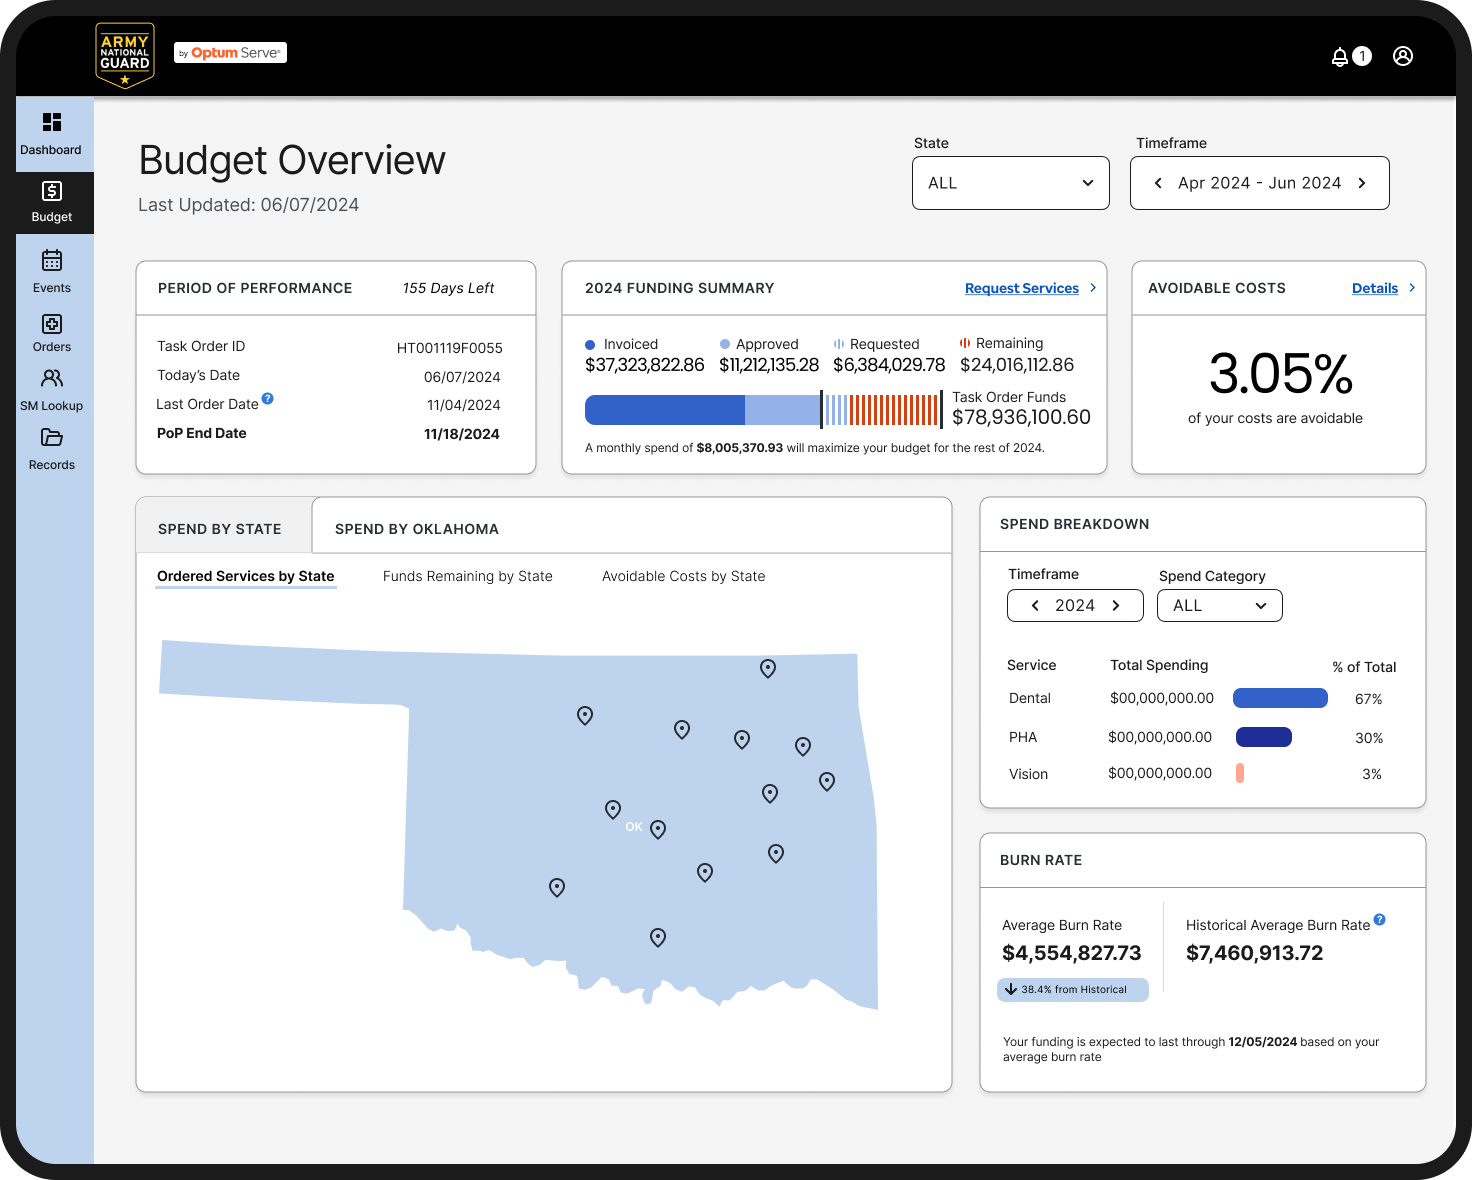
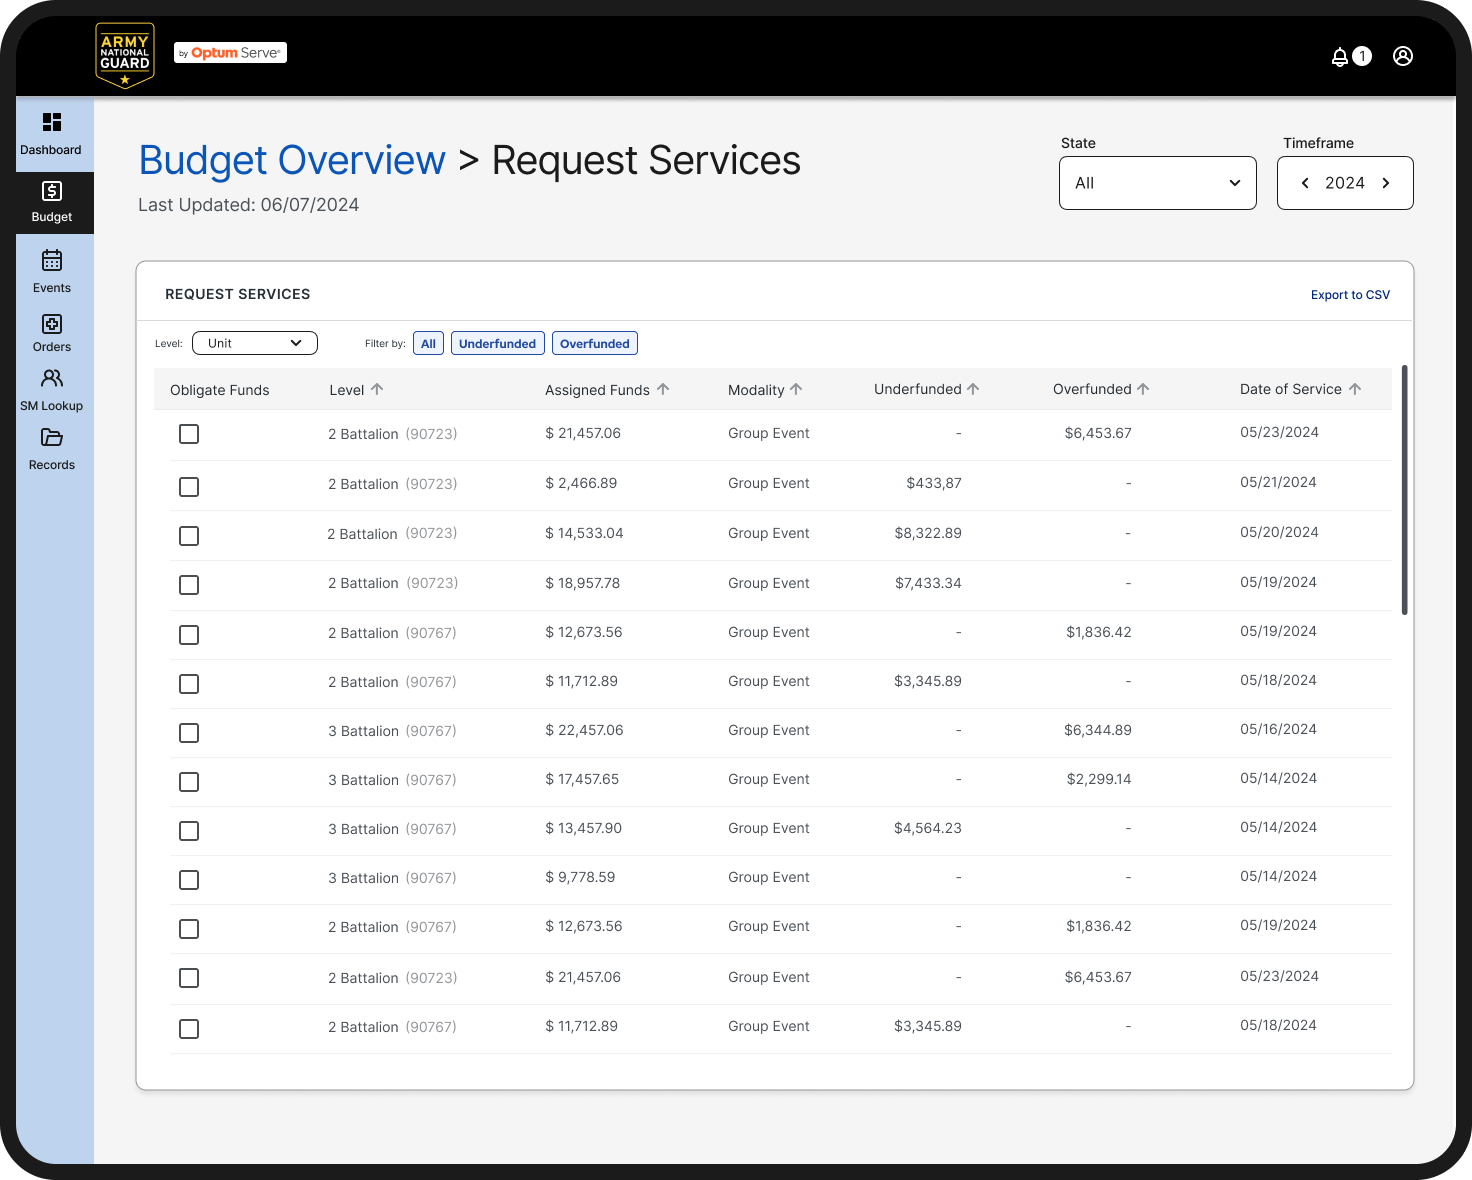
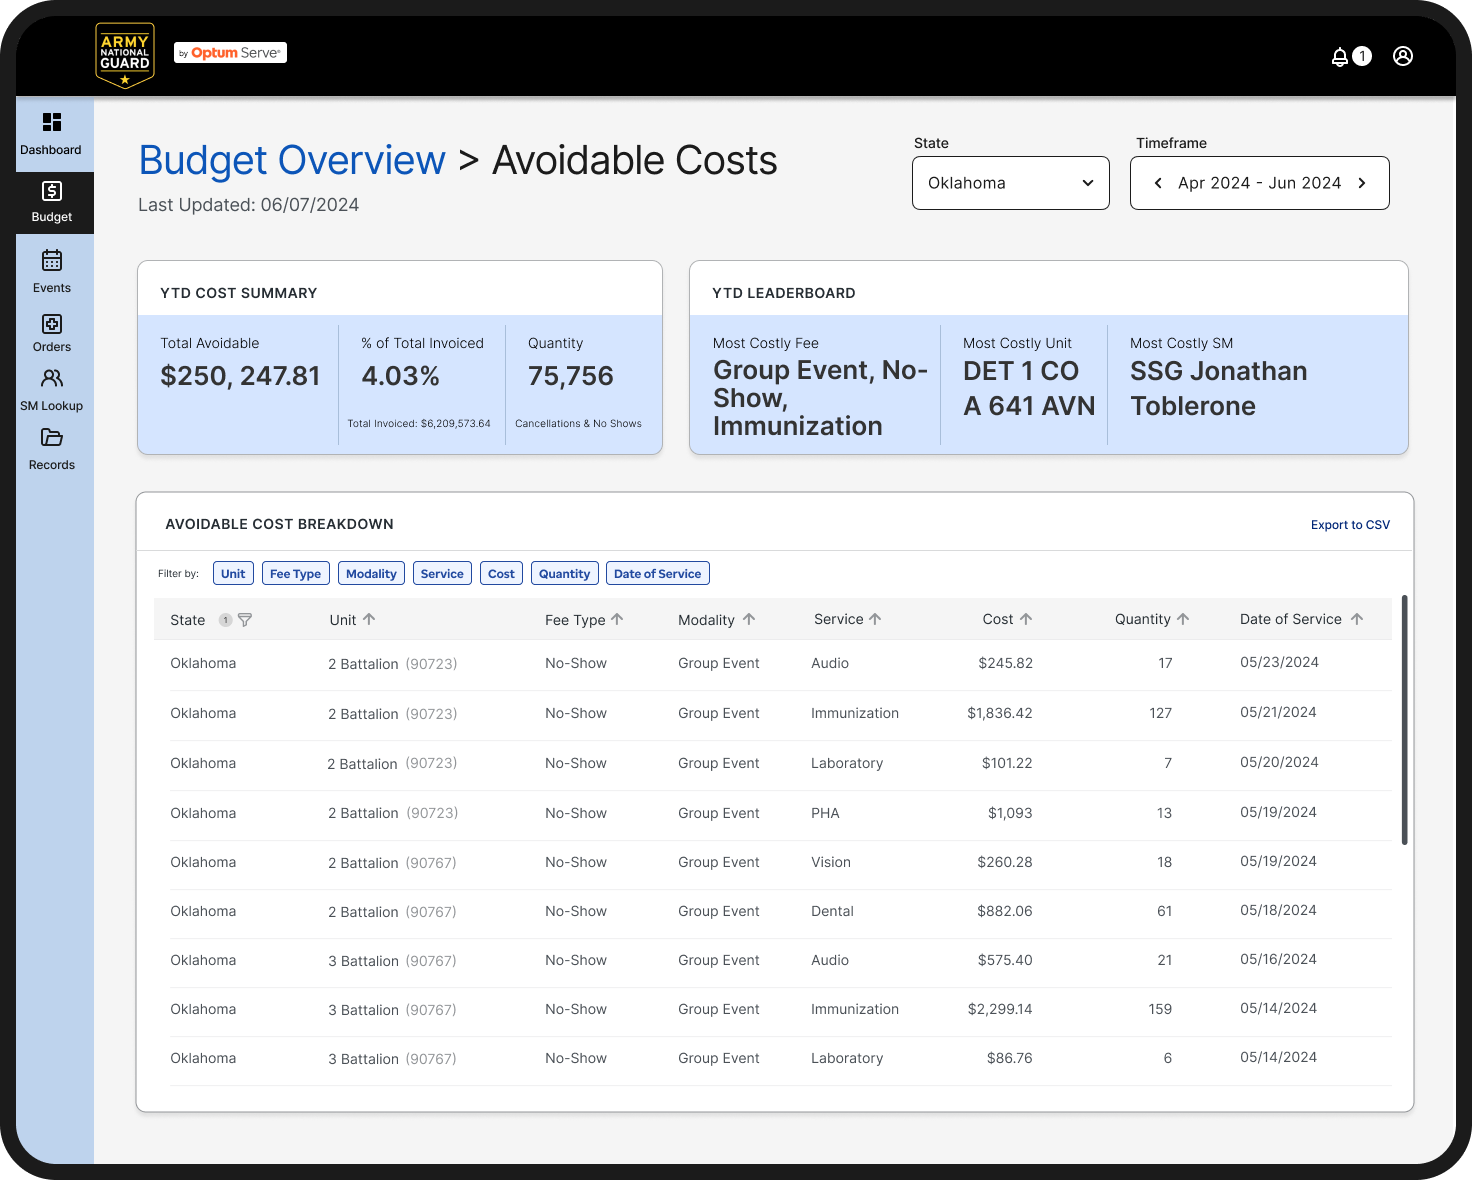
Based on our understanding of the PWS, we created these screens.
Key Decisions
Redesign to focus on choosing components and task orders.
User at DHA level needs to be able to quickly change the view by component
Simplify by using graphs and donut chart.
US map and state view is nice, but views are not really by location, rather units
Use Tablaeu and PowerBI design components
New design components would require additional work
Result & Impact
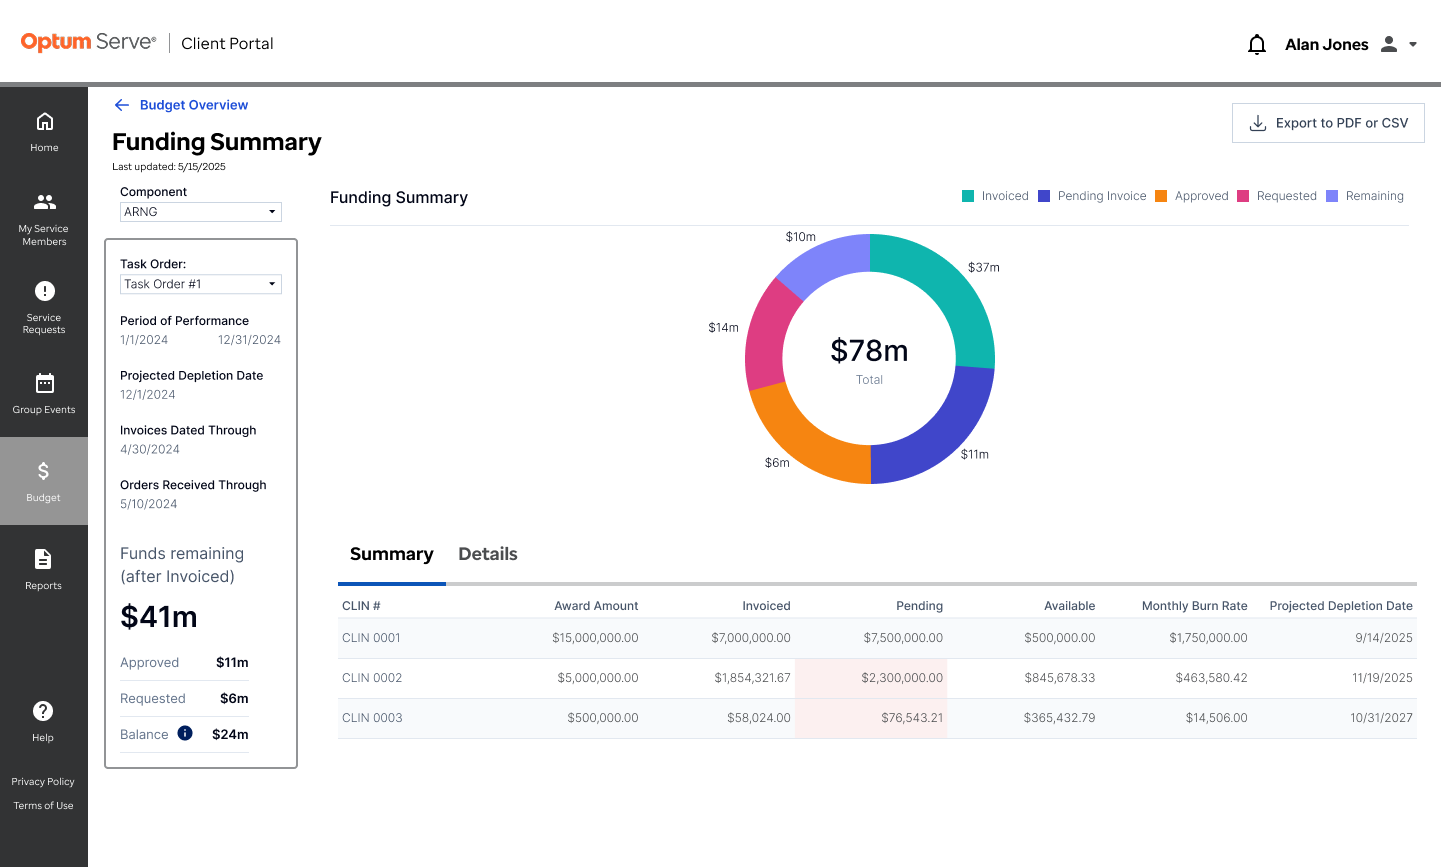
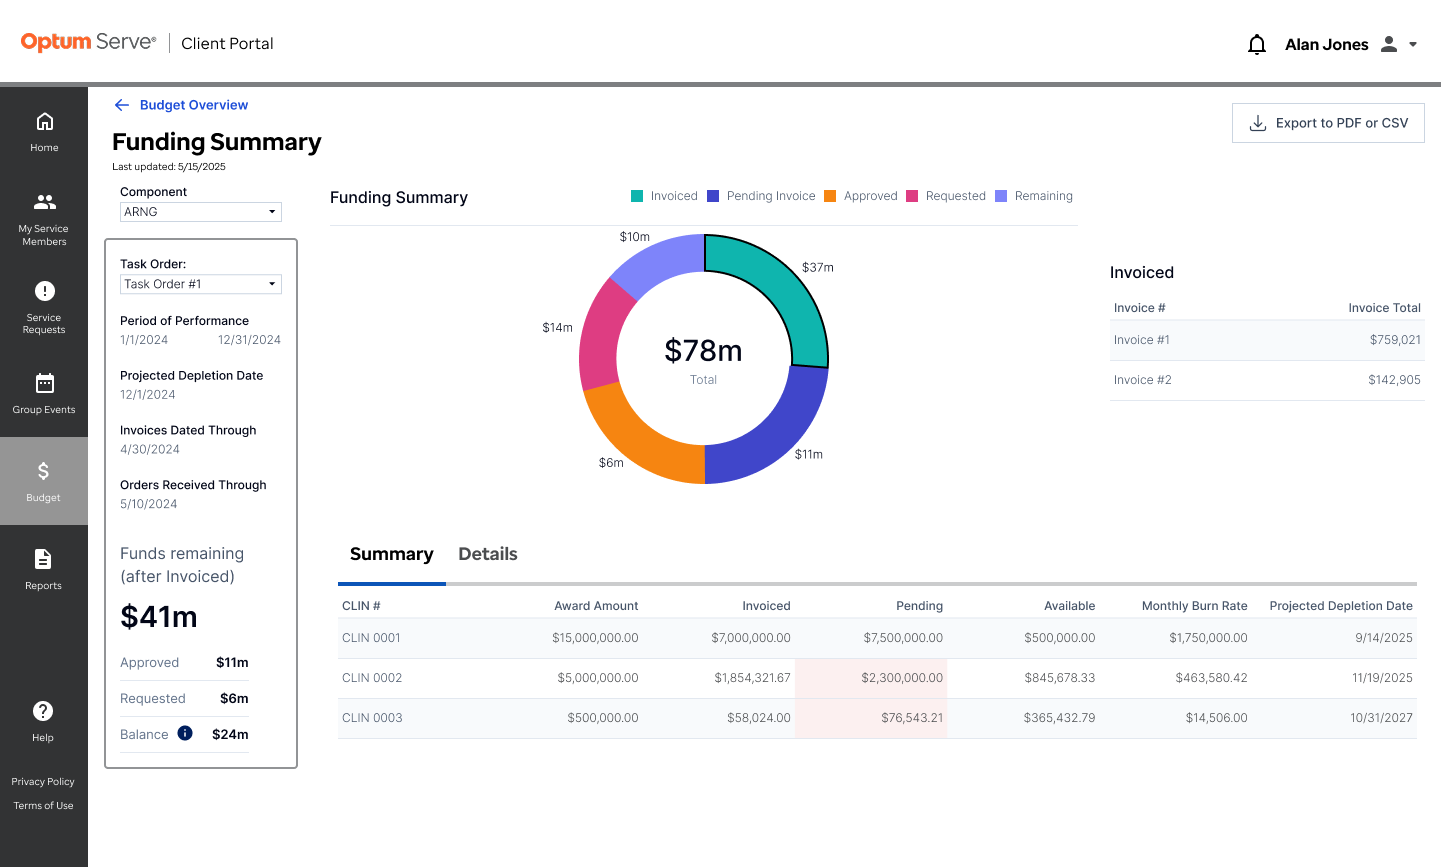
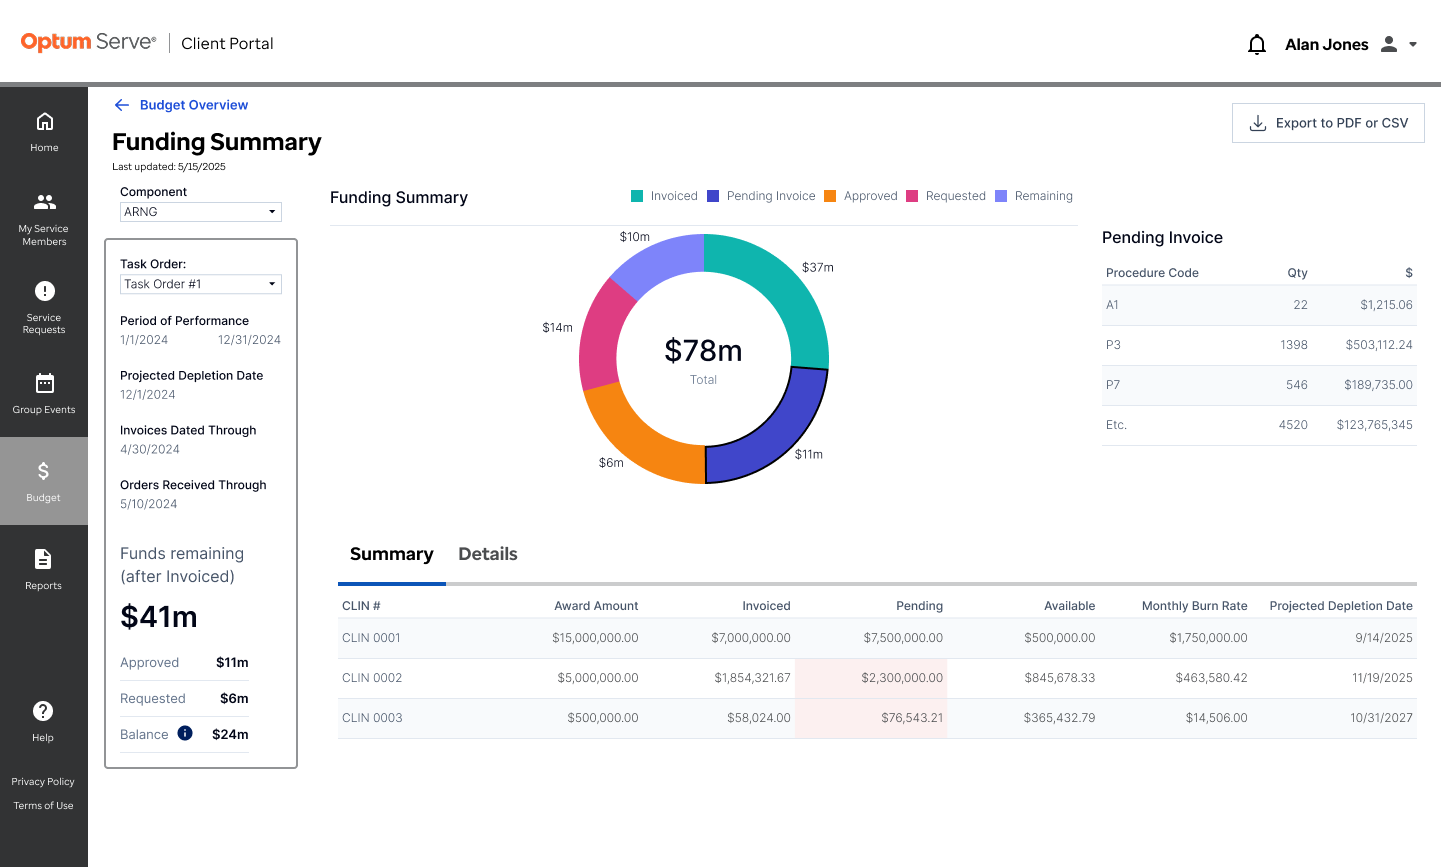
Dashboard focusing on selecting components (for the DHA level) and picking Task Orders, as task orders have various amount of funding and spend.
Funding
Spending
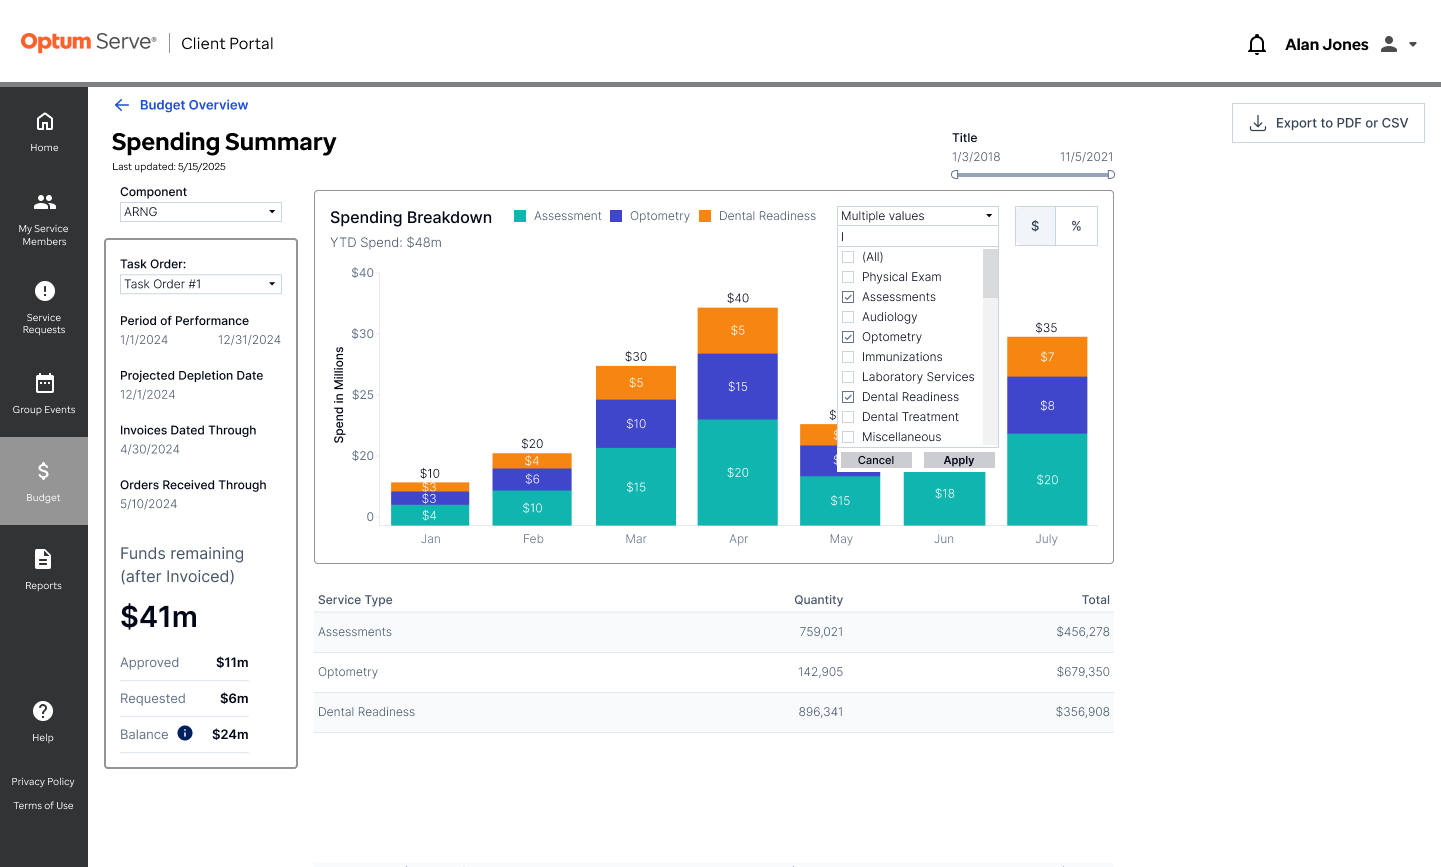
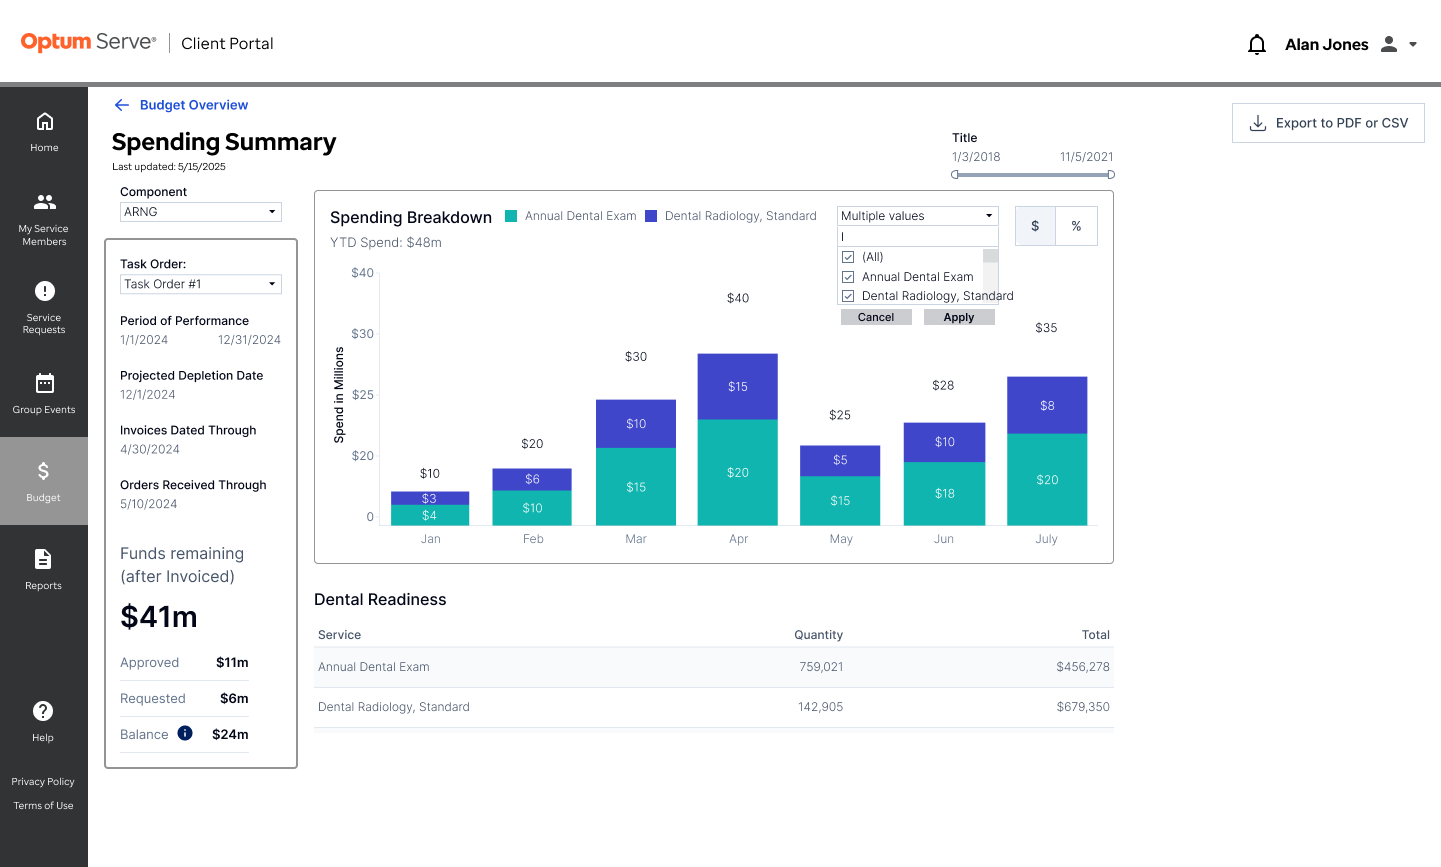
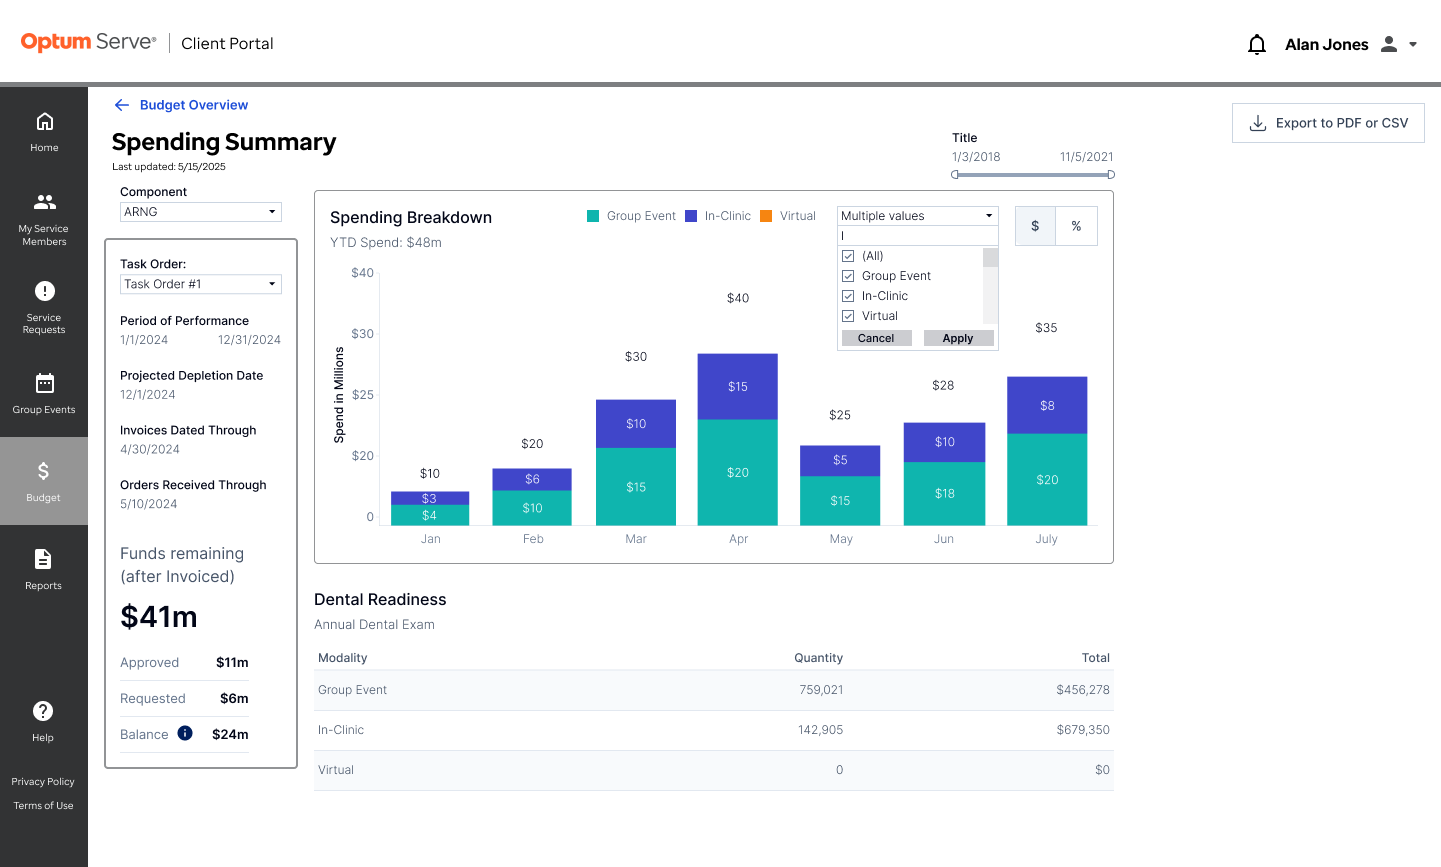
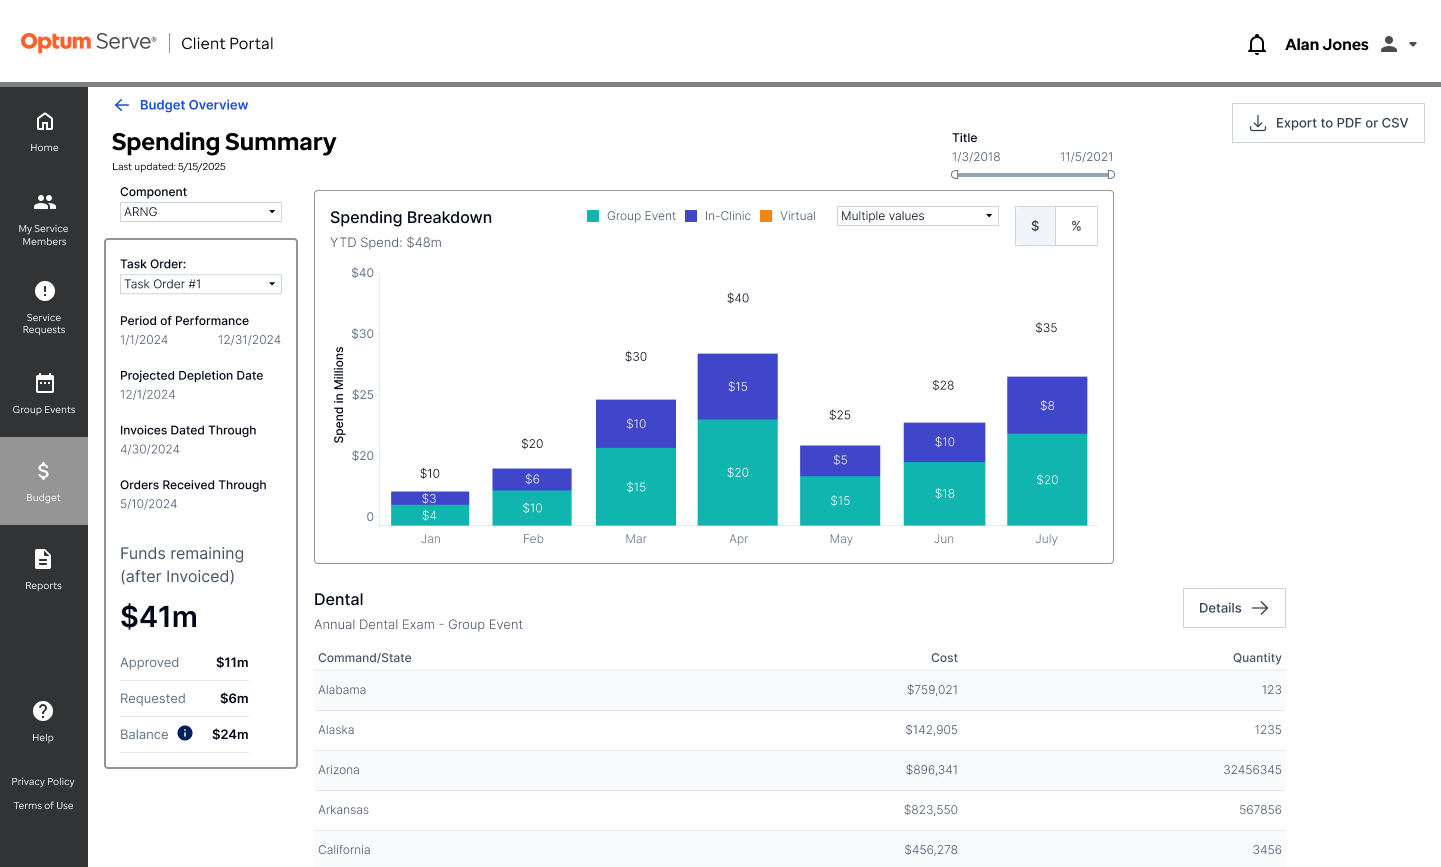
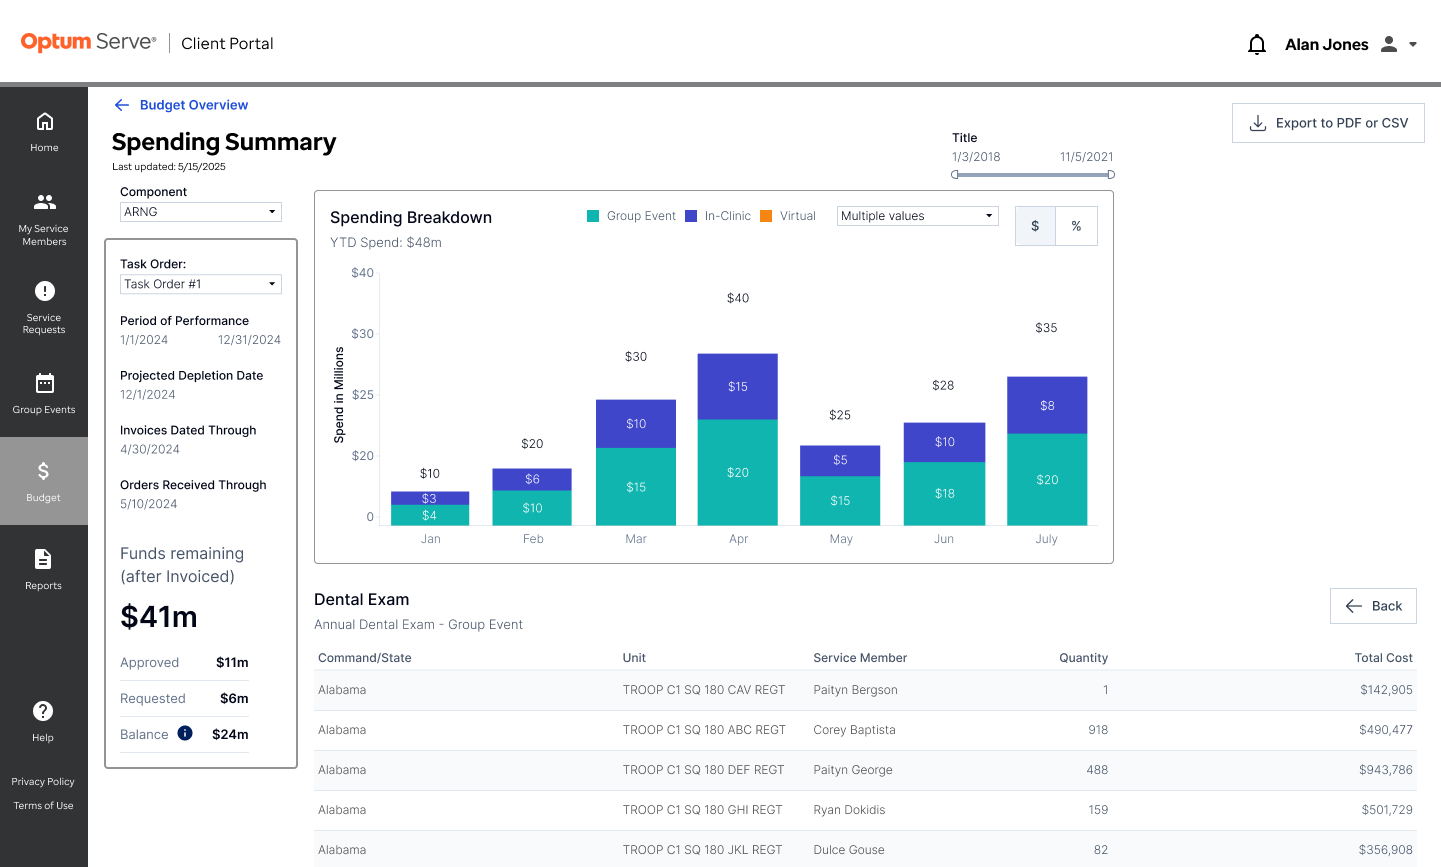
Spending is broken down by Procedure all the way down to modality and then to state to see how much procedures are costing and where.
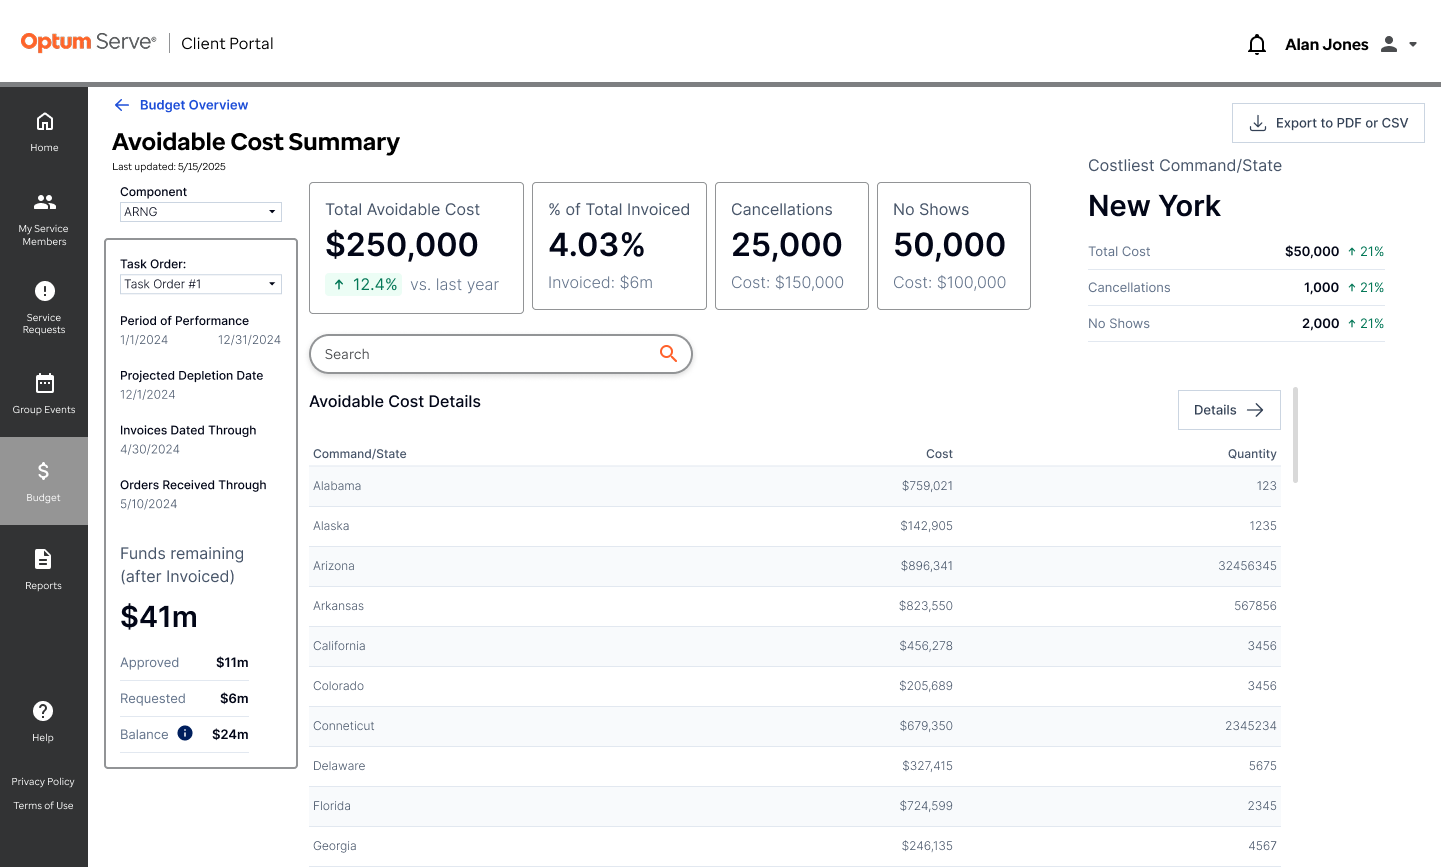
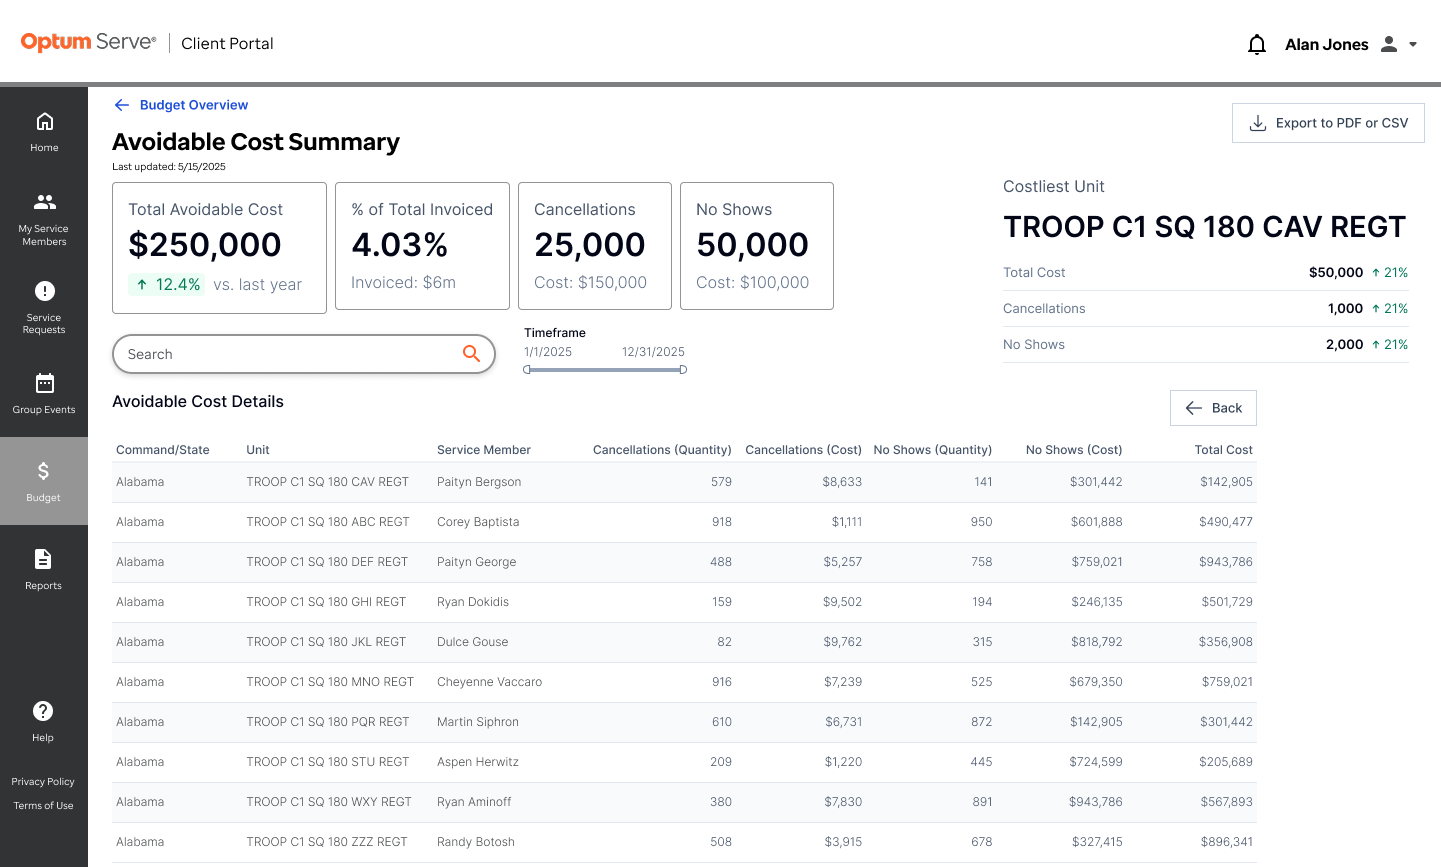
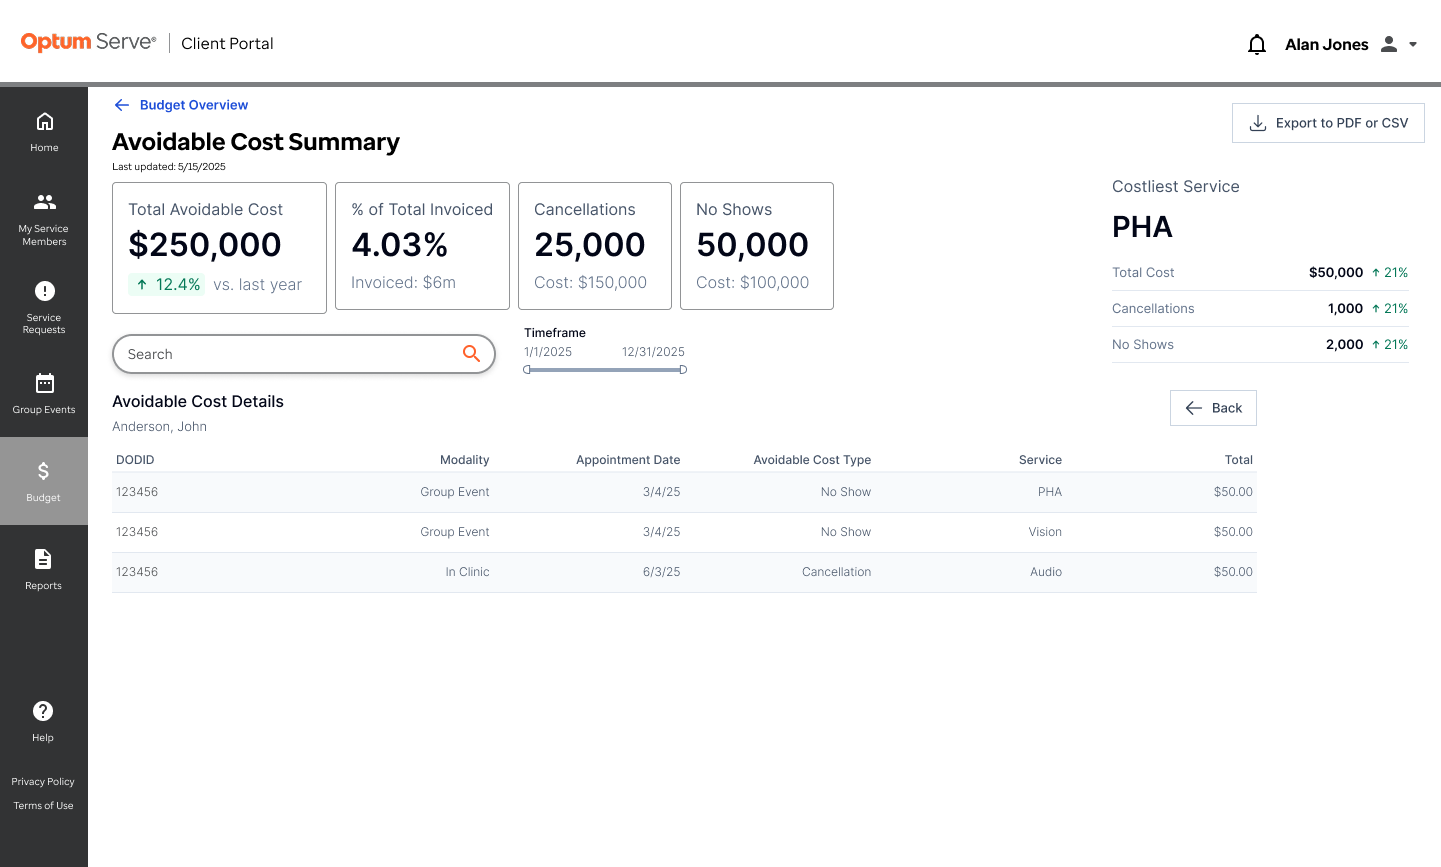
Avoidable Costs
Avoidable costs are broken down to the service member level to see who is costing the parties involved.
Learnings
- Avoidable costs consisting of late cancellations and no shows are extremely costly.
- Funding varies by numerous factors
- Task orders complicate the budget even more because there are more line items per task order.